“Buy the Dip”- a myth unfolded
Since the beginning of 2020 the U.S. Stock market has fallen 34%, risen 120%, declined 24%, and now has gained almost 18%.
The moral of the story is that we do not know what geopolitical, legislative, or economic circumstances are ahead. We certainly do not know how the various sectors of our economy will react to said circumstances and how markets will surge or plummet accordingly. Considering, one would have to be omniscient or trading on inside information to time an absolute bottom in the market or call a particular sector’s outperformance over any given period (especially over the course of the past 36 months).
Therefore, (given a long-term time horizon) the purchasing strategy that seems to account for all the above listed variants, and a strategy that is completely uncorrelated to a given economic environment, statistically speaking is the investing strategy that wins the day 67%[i] of the time since the inception of financial markets. This is a method referred to as Dollar-Cost-Averaging (DCA).
Dollar cost averaging is described as a fixed dollar amount invested in a regular basis every period regardless of market conditions. The goal is to reduce the impact of volatility of large purchases and to not attempt to time the market. Dollar cost averaging minimizes downside risk – in a sense more shares are purchased when stock prices are low and less shares are purchased when prices are higher.
So, we get it – given a long-term time horizon filled with a ton of uncertainty – having a buying strategy that will be implemented regardless of market conditions would make the most sense to perform well in the long run.
But do the numbers support?
For example, let’s say that on July 1, 2021, you began Dollar-Cost-Averaging $100 per month into the S&P 500 Index SPY (a benchmark index fund for global equity markets).
July 1, 2021: SPY price was $430.43
October 1, 2021: SPY price was $ 434.24
January 1, 2022: SPY price was $477.48
March 1, 2022: SPY price was $429.98
As of today (September 2, 2022): SPY price was $400.29[ii]
If buying into this fund from July 2021-January 2022 (as markets were reaching all-time-highs), your $100 monthly deposit would acquire fewer overall shares because the fund was relatively more expensive. As markets corrected (beginning in late January through today) your $100 monthly deposit would have acquired more shares at a relative discount. This is just a years’ worth of data, so imagine the roller coaster of price volatility one would experience over a 5+ year period – it would make your stomach churn. So why not figure out exactly what you can afford to contribute on a monthly or bi-weekly basis, and purchase shares regardless of market conditions?
Market Timing vs. DCA Case Study:
Buying the dip (market timing) tends to work better with assets that are in uptrends if you can buy at exact lows over an extended period. The fact of the matter is – if you are not omniscient or are trading on inside information (let’s hope) – it is extremely difficult to forecast short-term market behavior with any degree of accuracy or consistency. Further, in the manic economy that we have seen over the past two years, nailing an absolute bottom is nearly impossible and could rob you of the opportunity to be acquiring shares at a discount relative to their all-time highs. This in turn diminishes your portfolio growth and profit potential.
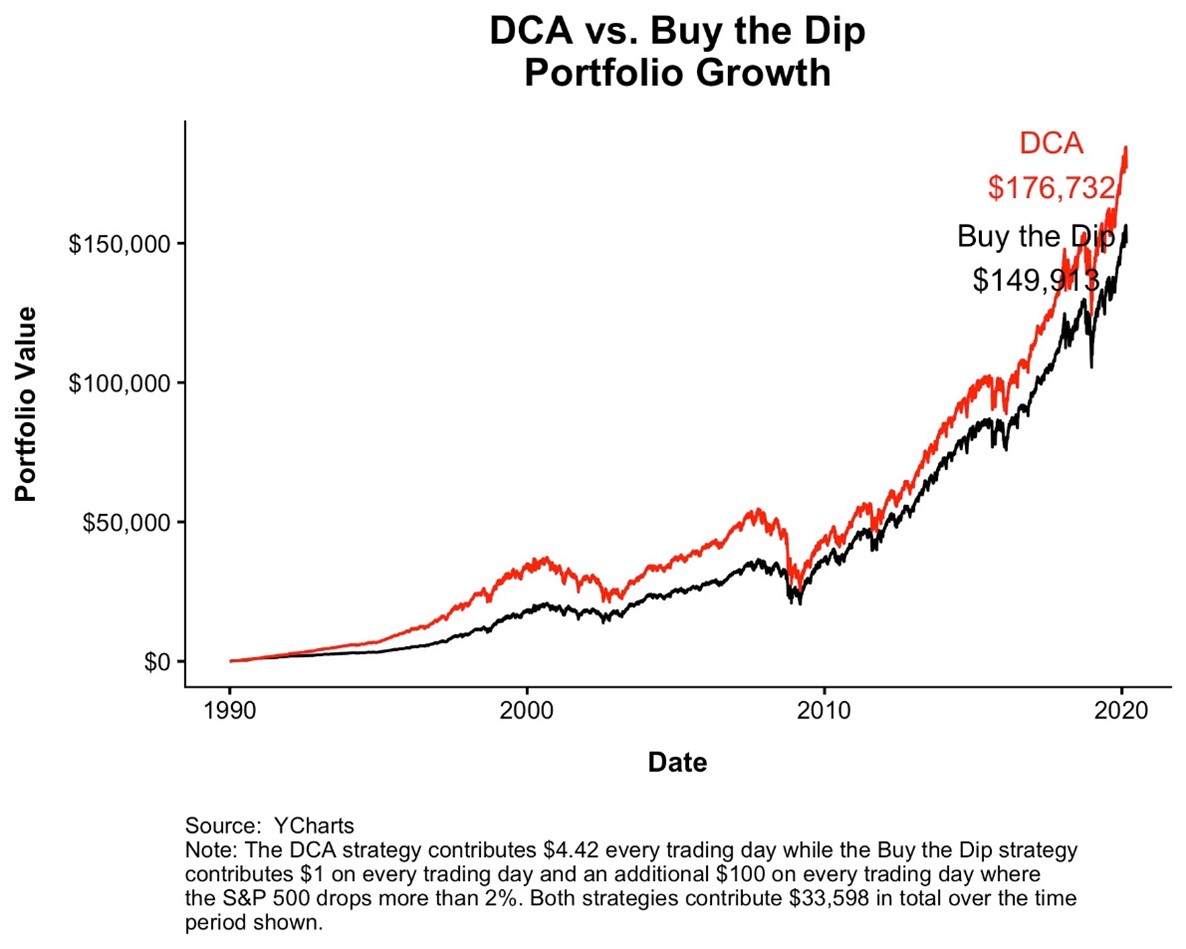
For example (as seen in the chart below) Let’s say that you invested $4.42 every trading day (DCA) as opposed to investing $1 on every trading day and an additional $100 on every trading day when the S&P 500 drops more than 2%. Both strategies will have invested a total amount of $33,598 over the span of 30 years. The Dollar-Cost-Averaging method (red) would end up with $26,819 more than the Buying the Dip method (black).
Again, while sitting on cash anticipating a downturn it is more likely that you will be waiting for the next ‘dip’ while the market rallies on, leaving you behind.
Initially I thought that buy the dip was going to outperform given that you are buying at the lowest point each year. You’re saving up cash as you go along and only buying at the bottoms. You’d think that this strategy would have to outperform, and it does whenever there is a significant drawdown in the markets (big dip). The problem is that in most of market history there’s not that many big dips. So, if you could imagine a market that just goes up forever – and if there are no dips – you would never buy.
The S&P 500 has had 11 bear markets with drawdowns of 35% or more dating back to the 1920s[i] so there are not that many instances of huge dips- but there are 10% corrections per year on average, 20% every 3 years. So, you do have those opportunities but most of the time you are sitting on cash. If you have 12 months in a row of all-time highs, you are just sitting in cash and not buying and robbing yourself the ability to acquire profitable assets at a relative discount.
Considering – if you are in the accumulation period of your savings journey with a relatively long-time horizon – it would be much more advantageous for one to figure out how much they can afford to invest on a monthly/bi-weekly basis and run the gauntlet until either you can no longer afford to contribute said amount or reach retirement.
[1] Link to this stat: https://www.optimizedportfolio.com/dca/
[1] SPY prices July 1,2021 – June 28, 2022: https://finance.yahoo.com/quote/SPY/history?p=SPY
[1] Picture sourced by YCharts
Dollar Cost Averaging does not assure a profit and does not protect against loss in declining markets. Also, since such a program involves regular investment purchases regardless of fluctuating price levels of the investment, consider your financial ability to continue purchases through periods of low price levels.
This material represents an assessment of the market environment at a specific point in time and is not intended to be a forecast of future events, or a guarantee of future results. This information should not be relied upon by the reader as research or investment advice regarding any funds or stocks in particular, nor should it be construed as a recommendation to purchase or sell a security. Past performance is no guarantee of future results. Investments will fluctuate and when redeemed may be worth more or less than when originally invested.
The S&P 500 Index is an unmanaged index of 500 stocks that is generally representative of the performance of larger companies in the U.S. Please note an investor cannot invest directly in an index.
4921107/DOFU 9-2022